Splunk DbMon
Powerful DB monitoring, built for visibility
DBMon for Splunk gives real-time insights into database performance, queries, and issues — all within your Splunk dashboard. Stay ahead, reduce downtime, and take control.


Key Features
Deep visibility and control over your database infrastructure.
DBMon empowers teams with real-time metrics, alerts, and visualizations — optimized for use with Splunk.
Real-Time Metrics
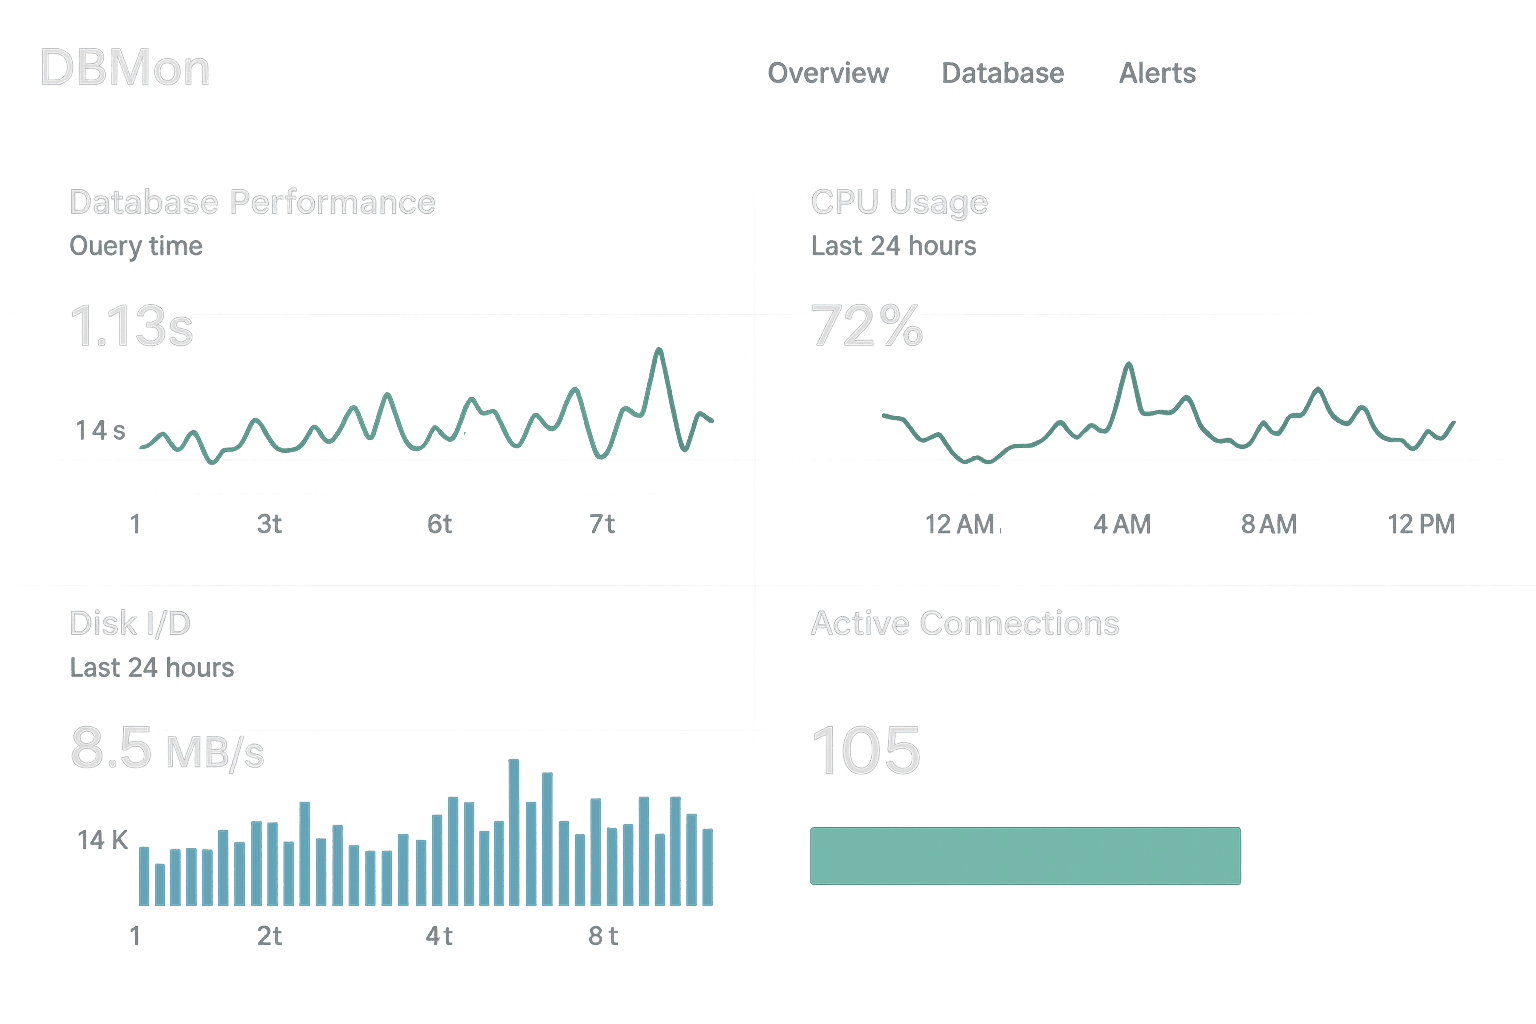
Monitor live database performance — from query time and CPU usage to connection counts and disk I/O — directly within your Splunk dashboards.
Query-Level Insights
Analyze slow queries, execution frequency, and resource consumption to pinpoint and resolve bottlenecks faster.
Smart Alerts & Thresholds
Configure custom alerts for anomalies, errors, or performance drops, and get notified instantly via your existing Splunk alerting system.
Pre-Built Dashboards
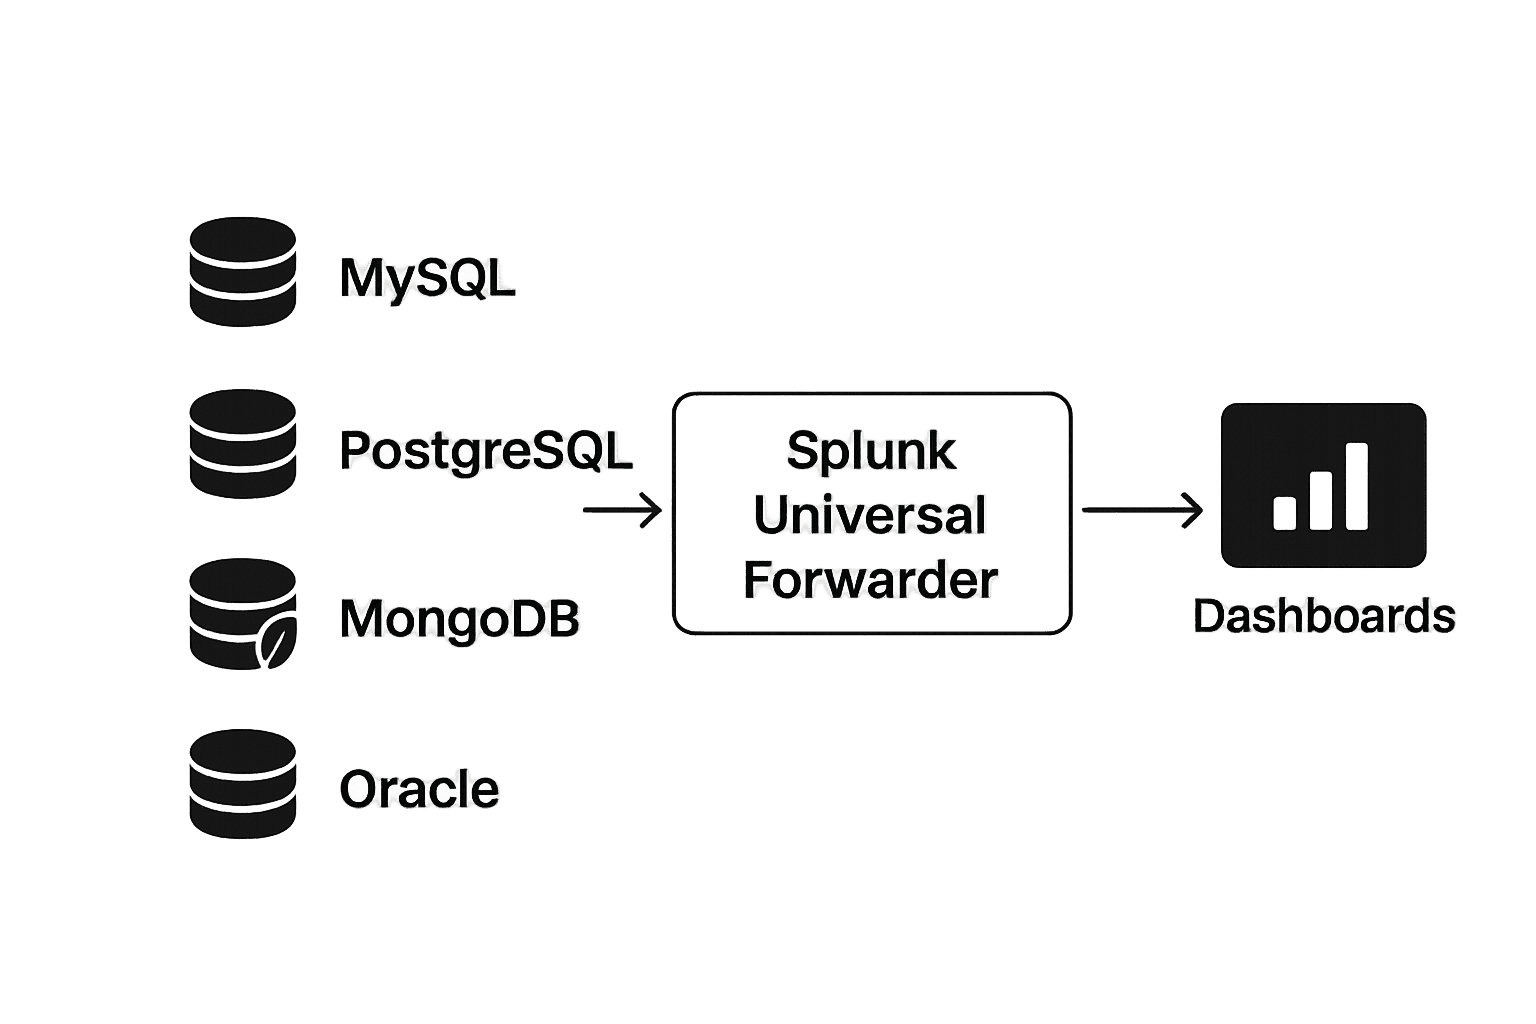
Launch with fully designed dashboards tailored for MySQL, PostgreSQL, MongoDB, Oracle, and more — no extra setup needed.
Simple Integration
Get started in minutes with our lightweight DBMon agent and Splunk Universal Forwarder. No heavy configuration or overhead.
Stay ahead of issues. Monitor with precision. Decide with confidence.
Let's talk about how DBMon can help you simplify Databricks monitoring and alerting — securely and effectively.
